Birt cross-tab for dynamic columned report
Birt cross-tab for dynamic columned report
A cross tab presents data in a matrix and summarize data in a compact format. It displays data by aggregating the column and row. The cross tab can groups column and the row by sum, max, min, first etc.
Visit below URL for the latest tutorial updates.
Target of this tutorial
In this tutorial we are going to create a cross-tabbed report for bellow data set. It contains the marks gain by some students for the exams. Different student sat for different subjects and bellow table contains student name, subject they faced, marks gained

You can download sample data set here
Our goal is to represent this data in a more readable format. Check bellow image to see the final output

Creating report design file
First we need to create report design file to create out report
Choose File→New→Project->Report Project. In this case I name it as Brit-Tutorial
Choose File→New→Project->Report Project. In this case I name it as Brit-Tutorial

Then create File→New→Report. I have named it as cross-tab.rptdesign and choose a blank report template to start with

|

|
Creating data source
Right-click Data Sources, and choose New Data Source.
Here I choose JDBC Data Source, then choose Next. Connection information about the new data source appears. Add details about the connection

Choose finish. Birt report designer creates a new data source that connects to the sample database.
Creating data set
In Data Explorer, right-click Data Sets, and choose New Data Set.
Right-click Data Sources, and choose New Data Source.

|

|
Here I choose JDBC Data Source, then choose Next. Connection information about the new data source appears. Add details about the connection

Choose finish. Birt report designer creates a new data source that connects to the sample database.
Creating data set
In Data Explorer, right-click Data Sets, and choose New Data Set.

|

|
Choose Next.
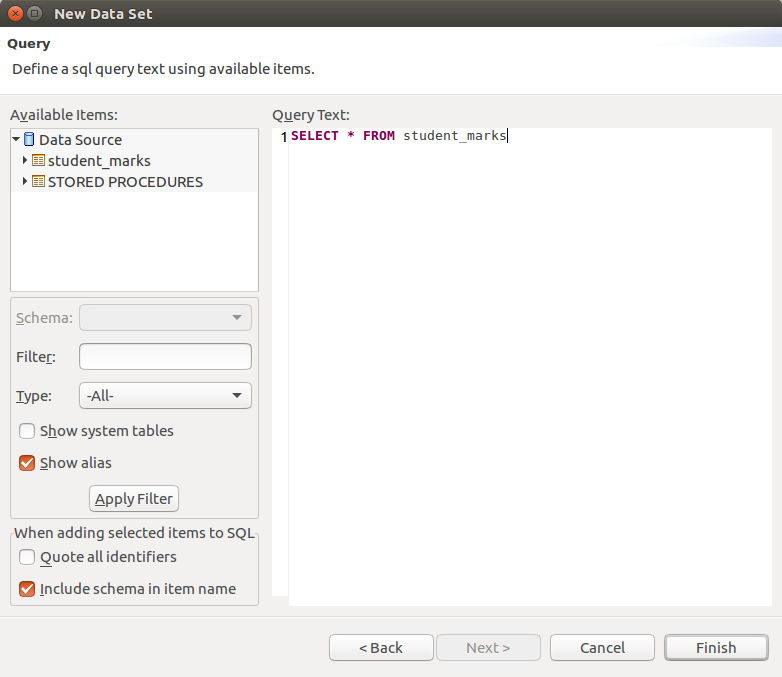
Write your sql query in the appeared window and hit next. I have added bellow query
Write your sql query in the appeared window and hit next. I have added bellow query
SELECT * FROM student_marks

|
|
Choose finish to save the data set.
Creating a data cube
Right-click Data Cubes, and choose New Data Cube.
Right-click Data Cubes, and choose New Data Cube.

|

|
Select Groups and Summaries row in the window, then you can see 2 ares called Available Fields and Groups and Summaries
- A data group, or dimension, containing values to use as the cross tab’s row headings or column headings
- A summary field, or measure, providing aggregate values to use in the cells of the cross tab
Drag and drop marks field in to the summary field and make a summary field. Here we use marks to aggregate values to use in the cells of the cross tab

|

|
By default marks summary field aggregates by using sum function. but here we need to change it into use first function. In order to do that we have to edit the marks summary field. The pop up window has a option to choose aggregate function.

Adding a cross tab to the report
Choose the palette, then drag a cross-tab element from the palette to the report. A cross tab design appears in the report.

|

|
Binding Data cube data with the design file
Drag Groups and summaries as bellow image and set labels as you preferred and then that's it. your data has linked to the design file

|

|
Hooray you have almost finished.
Now you can add borders and text styles as you need from the property editor in the eclipse

|

|
Lets preview the design.


That is all about the Birt cross-tab for dynamic columned report. You can download the whole Birt project from here
Thanks for reading the tutorial.
Thanks for reading the tutorial.
Visit below URL for the latest tutorial updates.
- Sample data set : https://github.com/AkilaMahesha/Birt-Tutorial/blob/master/sql/cross-tab.sql
- Birt-Tutorial project : https://github.com/AkilaMahesha/Birt-Tutorial.git
What a nice post. I appreciate about it. Do you know about bip candy toys uk limited then tell me. Or have another site like this share with me. Thanks a lot!!
ReplyDelete